


climate
Economics Analysis
economics strategy
sustainability
Trade
Climate commitments are multiplying, but the emissions data needed to verify them is too slow, aggregated and inconsistent to act on. Comparing two leading datasets across 219 countries, we find estimates diverge by up to 44% in transport and 34% in fossil fuel operations, and far more in lower-income economies. As new trade and disclosure rules turn emissions evidence into a condition of market access and finance, these blind spots are becoming competitiveness risks. The answer is not more reporting, but stronger, technology-enabled measurement that turns uncertainty into decision-useful evidence.
Climate policy has a measurement problem it has yet to confront. Governments and companies have made more climate commitments. For example, the Science Based Targets initiative reported a 40% rise in companies with validated science-based targets in 2025 and released its Corporate Net-Zero standard V2.0 in June 2026 as the updated framework for corporate net-zero target-setting.[1],[2] However, the information needed to test those commitments is often slow, aggregated, inconsistent across borders, or unable to follow the emissions through complex supply chains. In that environment, the decisive question is not simply whether more data exist. It is whether the right emissions can be seen clearly enough, early enough and at the right level of detail for someone to act.
Technology is changing that answer. Satellite observations, remote sensing, artificial intelligence (AI), facility-level data and digital traceability are expanding what can be observed beyond conventional reporting cycles. This does not make national inventories obsolete, nor does it turn a platform estimate into the final word on performance. It does, however, change the practical foundations of climate accountability. When emissions become more visible, it becomes easier to identify where verification, investment and policy attention are most needed.
Better visibility now carries direct commercial stakes, because emissions evidence has moved from a periodic environmental reporting exercise into the operating conditions of trade, investment and market access. Several regulatory developments are bringing this into sharp focus simultaneously. For example, the European Union (EU) Carbon Border Adjustment Mechanism (CBAM), which entered its definitive phase in January 2026, requires importers of carbon-intensive goods, including cement, iron and steel, aluminium, fertilisers, electricity and hydrogen, to submit verified embedded emissions data and surrender corresponding carbon certificates.[3] Importers who cannot substantiate their figures face exposure equivalent to the EU Emissions Trading System carbon price, which potentially increases their carbon-cost exposure.[4]
Regulatory pressure is raising the bar for emissions measurement. The EU Corporate Sustainability Reporting Directive (CSRD) brings climate and sustainability reporting into mandatory corporate disclosure for large companies operating in Europe, including certain non-EU firms with significant EU activity.[5] The International Financial Reporting Standards (IFRS) S2, effective for annual reporting periods beginning on or after January 2024, establishes a global baseline for climate-related financial disclosures across a growing number of jurisdictions.[6] Both frameworks increase demand for emissions data that is granular, comparable across value chains and capable of external assurance, a gap that technology-enabled measurement is well placed to address.
This pressure extends beyond regulation. Lenders conducting climate stress tests, institutional investors assessing portfolio alignment, and procurement teams engaging suppliers on emissions performance are all asking for climate data that is credible beyond the company’s own reporting system. Where the underlying measurement is weak, inconsistent or difficult to reconcile with external estimates, commercial risk can accumulate even before a formal non-compliance finding is made.
For Asia-Pacific exporters and their supply chains, this increased emphasis on compliance is already an operational reality, not a distant policy signal. A steel manufacturer in Indonesia, a palm oil trader in Malaysia, or a logistics provider in Vietnam may face emissions-evidence demands not from a single regulator, but from multiple commercial counterparts, including European buyers, lenders, and investors, with each working through its own reporting, procurement, or risk-management requirements. Meeting several overlapping requirements at once is more complex than complying with a single rule, especially where existing data systems cannot yet provide emissions evidence that is granular, comparable, and credible.
Part of the difficulty is that even the most credible sources do not agree on the numbers. We compared two of the most credible global emissions datasets, Climate TRACE and Emissions Database for Global Atmospheric Research (EDGAR), across 219 countries and six sectors from 2015 to 2024. They track the same underlying metrics including greenhouse gases (GHG) by gas type, emission sector and geography, but take fundamentally different approaches: Climate TRACE, an independent coalition launched in 2020, uses satellite imagery, remote sensing, AI algorithms and verified reference data to estimate GHG emissions at a more granular and timely level than traditional inventories;[7],[8] EDGAR GHG, first developed in early 1990s and maintained by the European Commission, applies a consistent Intergovernmental Panel on Climate Change (IPCC) methodology built on independent activity data and emission factors, prioritising methodological consistency and historical comparability. [9], [10]
The gap between the two datasets is far from uniform across sectors. The power sector, where Climate TRACE and EDGAR align most closely, serves as the reference baseline for our analysis. Against that baseline, after controlling for country and year differences, two sectors stand out. Transportation shows the largest gap: Climate TRACE and EDGAR estimates diverge by roughly 44% on average. Fossil fuel operations follow, with the two datasets diverging by around 34%. At the lower end, waste and manufacturing show relatively smaller gaps at about 12% and 10%, respectively. These are narrower than the standout sectors, but they are measured against the power sector baseline, so they are far from trivial. That is not a verdict on data quality; it is simply what happens when emissions are mobile, scattered, intermittent and tied to specific assets, which makes them hard to pin down through routine reporting.
Exhibit 1: Emission estimate gaps by sector between Climate TRACE and EDGAR, when compared against the power sector baseline
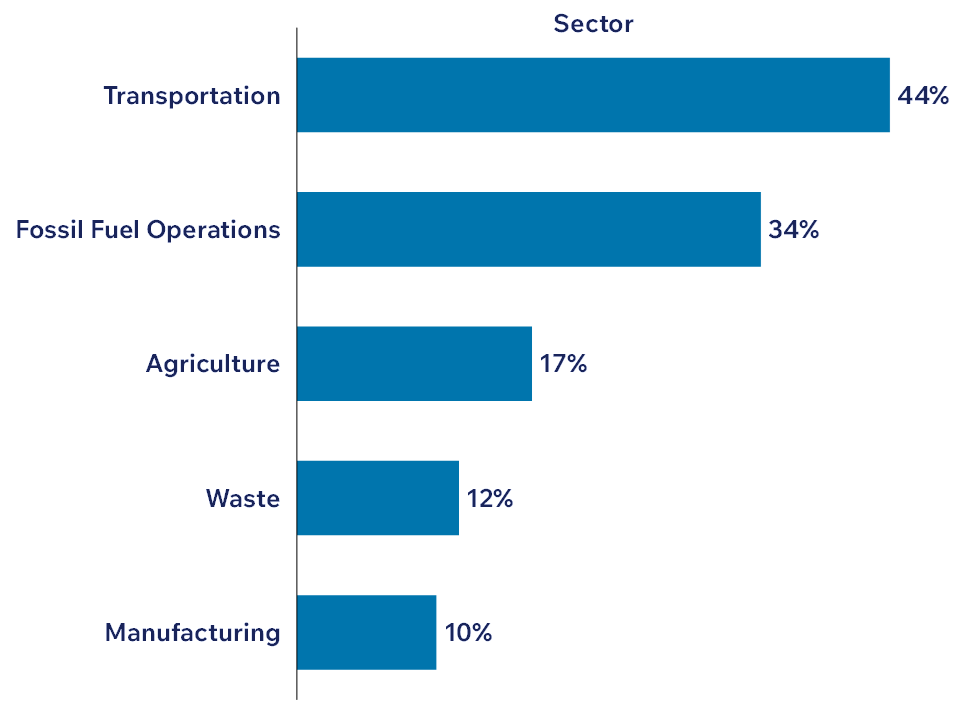
Note: Power is excluded as it is the reference category. Larger values indicate greater divergence between two credible datasets using different methods and inputs. Sector coverage is limited to categories that can be mapped consistently between Climate TRACE and EDGAR; ambiguous categories are excluded to avoid overstating comparability.
Source: Access Partnership analysis using Climate TRACE and EDGAR 2025.
Each of these sectors is structurally difficult to observe. Aviation and shipping activities cross borders and slip between national reporting boundaries. Road transport emissions shift constantly with fleet compositions, fuel quality and driving patterns. Fossil fuel operations leak methane from wells, pipelines and processing plants. The leaks come in scattered, intermittent bursts, often too faint for ground-level monitoring to catch. The International Energy Agency (IEA) identifies fossil fuel operations as one of the world’s largest sources of human-caused methane emissions, while satellite and other remote-sensing studies show that measured emissions from oil and gas operations often exceed official or industry-reported estimates.[11],[12],[13] These are exactly the places where modern technological observation tools earn their keep.
A gap between two datasets reflects the different technologies, models and detection methods used to produce each estimate. It can come from different source coverage, data vintage, sector definitions, activity data or modelling choices, or simply one method being able to see a source that the other cannot. They mark where the information system needs a second look, where independent verification pays off, and where public or private actors might make ill-informed decisions based on a partial view of the emissions picture.
Beyond sectors, measurement gaps also show up across the economic development spectrum. We split countries in the analysis by World Bank income groups into two categories: low and lower-middle income countries on one side, and upper-middle and high income countries on the other. The gaps are large in both income categories, and widest where measurement capacity is thinnest.
Transportation remains the sector with the largest divergence relative to the power sector in both income categories. The gap is especially pronounced in low- and lower-middle-income countries, at about 68%, compared with 33% in upper-middle- and high-income countries. Fossil fuel operations show a similar pattern, with a 62% gap in low- and lower-middle-income countries versus 22% in upper-middle- and high-income countries. By contrast, the waste sector shows the least variation across income groups, with gaps of 14% and 13%, respectively.
These results highlight that the emissions visibility challenge has a clear capacity dimension. Lower-income countries, which often have more limited monitoring infrastructure, administrative data systems and verification capacity, are less able to produce the credible emissions evidence that buyers, lenders and regulators increasingly require. This creates a material risk for market access and competitiveness.
For Asia-Pacific, the capacity gap is directly linked to trade competitiveness. The region spans the full income spectrum, from mature systems in Japan, South Korea and Australia to fast-industrialising economies where emissions data collection is still developing. It also includes many suppliers exposed to carbon-data requests from overseas customers, lenders and regulators in the EU, the United Kingdom and the United States. As a result, a widening visibility gap risks becoming a competitiveness gap, particularly for exporters that must meet increasingly detailed emissions-evidence requirements to maintain market access.
Exhibit 2: Emission estimate gaps by sector between Climate TRACE and EDGAR, as compared with the power sector baseline, by country income categories
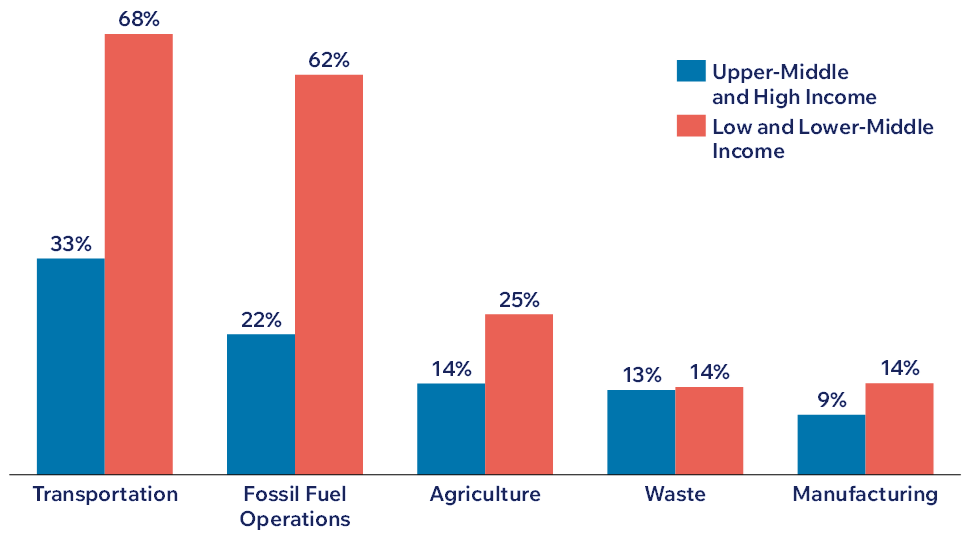
Note: The power sector is excluded as the reference category. Larger values indicate greater divergence between two credible datasets using different methods and inputs. Sector coverage is limited to categories that can be mapped consistently between Climate TRACE and EDGAR; ambiguous categories are excluded to avoid overstating comparability.
Source: Access Partnership analysis using Climate TRACE, EDGAR 2025, and World Bank.
Firms that can demonstrate credible performance will respond more quickly to buyer and lender requests and face lower verification costs. Those without reliable data face growing friction, even where their underlying performance is improving. Addressing this requires more than corporate investment in better reporting systems. It requires public policy that treats monitoring infrastructure as shared economic infrastructure rather than a compliance burden left to individual firms to resolve.
A stronger emissions measurement system should connect the evidence companies and governments already use. National inventories provide economy-wide consistency and public accountability.[14] Corporate reporting links emissions to governance, risk management and financial disclosure.[15] Facility-level records turn emissions data into operational decisions. Remote sensing and other technology-enabled estimates help identify outliers, missing sources and priority locations. Product-level accounting and traceability then allow verified emissions evidence to move through supply chains, so accountability follows goods across markets.[16]
Disagreement between datasets should become a trigger for better verification, not a source of confusion. When inventories, company reports and independent estimates diverge, policymakers and firms can use the gap to ask sharper questions: whether a source is missing, whether sector boundaries are comparable, whether activity data are current, and where independent verification should be prioritised. Better measurement, therefore, creates a practical workflow: identify uncertainty, focus assurance where it matters most, and test whether mitigation is delivering results.
The Global Methane Pledge shows why these matter. Participants have committed to a collective effort to reduce global methane emissions by at least 30% from 2020 levels by 2030, while also improving the accuracy, transparency, consistency, comparability and completeness of national GHG inventory reporting.[17] Meeting this ambition requires more timely and asset-level visibility than conventional annual reporting systems can provide on their own. Satellite alerts, facility-level estimates and methane-intensity records are most valuable when they are connected to clear responsibility, response authority and resources for mitigation.
Technology-enabled measurement strengthens policy, investment and enforcement by making them more targeted. Governments can use better detection to prioritise inspections and support. Firms can use facility-level evidence to direct capital expenditure. Buyers, lenders and investors can use comparable data to assess supply-chain and portfolio risks. In each case, the value comes from turning measurement into decision-useful evidence.
The next phase of climate accountability depends on evidence systems that can test progress. Governments need emissions visibility to direct support, inspection and enforcement where the gaps are largest. Investors need comparable data to assess whether transition plans are backed by measurable progress. Firms need reusable evidence that reduces the cost of proving performance across regulators, buyers and financiers. Civil society needs clearer information to test whether claimed reductions are real.
Technology-enabled measurement is most valuable where conventional visibility is weakest: mobile, dispersed and hard-to-monitor sectors, and economies where administrative data systems and verification capacity are still developing. Its role is to make uncertainty actionable. When estimates diverge, better measurement helps identify where verification is needed, where mitigation should be prioritised, and whether interventions are producing measurable results. That is the detection question this piece set out to answer: better measurement makes it possible to see where the data already fails, and to act on the gap. Future instalments in this series turn to how technology also lowers emissions intensity and accelerates low-emission economic development.
At Access Partnership, we offer deep expertise at the intersection of sustainability, climate policy and economic development. Below is a selection of insights that demonstrate the breadth of our reach and experience, as well as reports that show our deep econometric expertise in quantifying economic impact.
[1] Science Based Targets (2026), “Corporate climate target-setting up 40% in 2025, with Asia emerging as a centre of gravity”. Available at: https://sciencebasedtargets.org/news/corporate-climate-target-setting-up-40-in-2025-with-asia-emerging-as-a-centre-of-gravity
[2] Science Based Targets (2026), “The Corporate Net-Zero Standard”. Available at: https://sciencebasedtargets.org/corporate-net-zero
[3] “Carbon Border Adjustment Mechanism”. Available at: https://taxation-customs.ec.europa.eu/carbon-border-adjustment-mechanism_en
[4] Ibid.
[5] European Parliament (2022), “Sustainable economy: Parliament adopts new reporting rules for multinationals”. Available at: https://www.europarl.europa.eu/news/en/press-room/20221107IPR49611/sustainable-economy-parliament-adopts-new-reporting-rules-for-multinationals
[6] IFRS (2026), “IFRS S2 Climate-related Disclosures”. Available at: https://www.ifrs.org/issued-standards/ifrs-sustainability-standards-navigator/ifrs-s2-climate-related-disclosures/
[7] Verified reference data refers to reliable measured or observed data used to train and validate emissions models, such as on-site emissions sensors verified by a third party.
[8] Climate TRACE (n.d.). Available at: https://climatetrace.org/approach
[9] Guizzardi, et al. “Global up-to date emissions using the EDGAR Fast-Track methodology”. Scientific Data. Available at: https://www.nature.com/articles/s41597-025-04806-2
[10] Emissions Database for Global Atmospheric Research (n.d.), “Global Greenhouse Gas Emissions”. Available at: https://edgar.jrc.ec.europa.eu/dataset_ghg2025
[11] IEA (n.d.), “Global Methane Tracker 2026”. Available at: https://www.iea.org/reports/global-methane-tracker-2026/key-findings
[12] Shen, et al. (2023), “National quantifications of methane emissions from fuel exploitation using high resolution inversions of satellite observations”. Nature Communications. Available at: https://www.nature.com/articles/s41467-023-40671-6
[13] Stanford Report (2024), “Methane emissions from U.S. oil and gas operations cost the nation $10 billion per year”. https://news.stanford.edu/stories/2024/03/methane-emissions-major-u-s-oil-gas-operations-higher-government-predictions
[14] United Nations Climate Change (n.d.), “National Inventory Reports”. Available at: https://unfccc.int/process-and-meetings/transparency-and-reporting/reporting-and-review/reporting-and-review-under-the-paris-agreement/national-inventory-reports
[15] Greenhouse Gas Protocol (n.d.), “Corporate Value Chain (Scope 3) Standard”. Available at: https://ghgprotocol.org/corporate-value-chain-scope-3-standard
[16] Greenhouse Gas Protocol (n.d.), “Product Standard”. Available at: https://ghgprotocol.org/product-standard
[17] Global Methane Pledge (2023), “Global Methane Pledge”. Available at: https://www.globalmethanepledge.org/resources/global-methane-pledge





Our dedicated experts, located around the world, are here to help.